How to process selected cells in Google Sheets

Why use data processing
Section titled “Why use data processing”After finding and selecting cells with Select Special, you often need to do something with that selection — extend it to full rows or columns within the data region, or apply calculations. Instead of manually adjusting selections or writing formulas one by one, Select Special can process your selection automatically.
Available actions
Section titled “Available actions”Select Special provides two processing actions:
| Action | Description | Use case |
|---|---|---|
| Expand Selection | Extend selected cells to data region boundaries | Select full rows or columns within the data region |
| Add Formula | Insert a formula next to selected cells | Calculate SUM, COUNT, AVERAGE, MIN, or MAX |
How to process selected cells
Section titled “How to process selected cells”1. Find and select cells
Section titled “1. Find and select cells”Use any Select Special action to find cells (e.g., “Entered values”, “Formulas”, “Cells with notes”).
2. Review results
Section titled “2. Review results”After the search completes, you’ll see the list of found cells. Click Next to proceed to processing.
3. Choose processing action
Section titled “3. Choose processing action”Select either “Expand Selection” or “Add Formula” and configure the options.
4. Process
Section titled “4. Process”Click Process to execute the action. You’ll see a summary with the results.
Expand Selection
Section titled “Expand Selection”Extends your selected cells to the boundaries of the surrounding data region (table).
Options
Section titled “Options”Choose one of the expand modes:
Expand selection to data row — extends selection horizontally to the data region edges.
| Direction | Description |
|---|---|
| Both | Expand to both left and right edges |
| Left | Expand only to the left edge of the data region |
| Right | Expand only to the right edge of the data region |
Expand selection to data column — extends selection vertically to the data region edges.
| Direction | Description |
|---|---|
| Both | Expand to both top and bottom edges |
| Top | Expand only to the top edge of the data region |
| Bottom | Expand only to the bottom edge of the data region |
How it works
Section titled “How it works”- Select Special determines the data region for each selected cell
- Each selection is extended in the chosen direction until it reaches the data region boundary
- Overlapping selections are merged automatically
Example: Select full rows for highlighted cells
Section titled “Example: Select full rows for highlighted cells”You have a table with project tasks and want to select the entire row for every cell with a yellow background:
- Use “Fill colors” to find all cells with a yellow background
- Choose “Expand Selection” → “Full row” → “Both”
- Click Process
Result: Every found cell’s selection now spans the full width of the data region, giving you complete rows ready for further action.
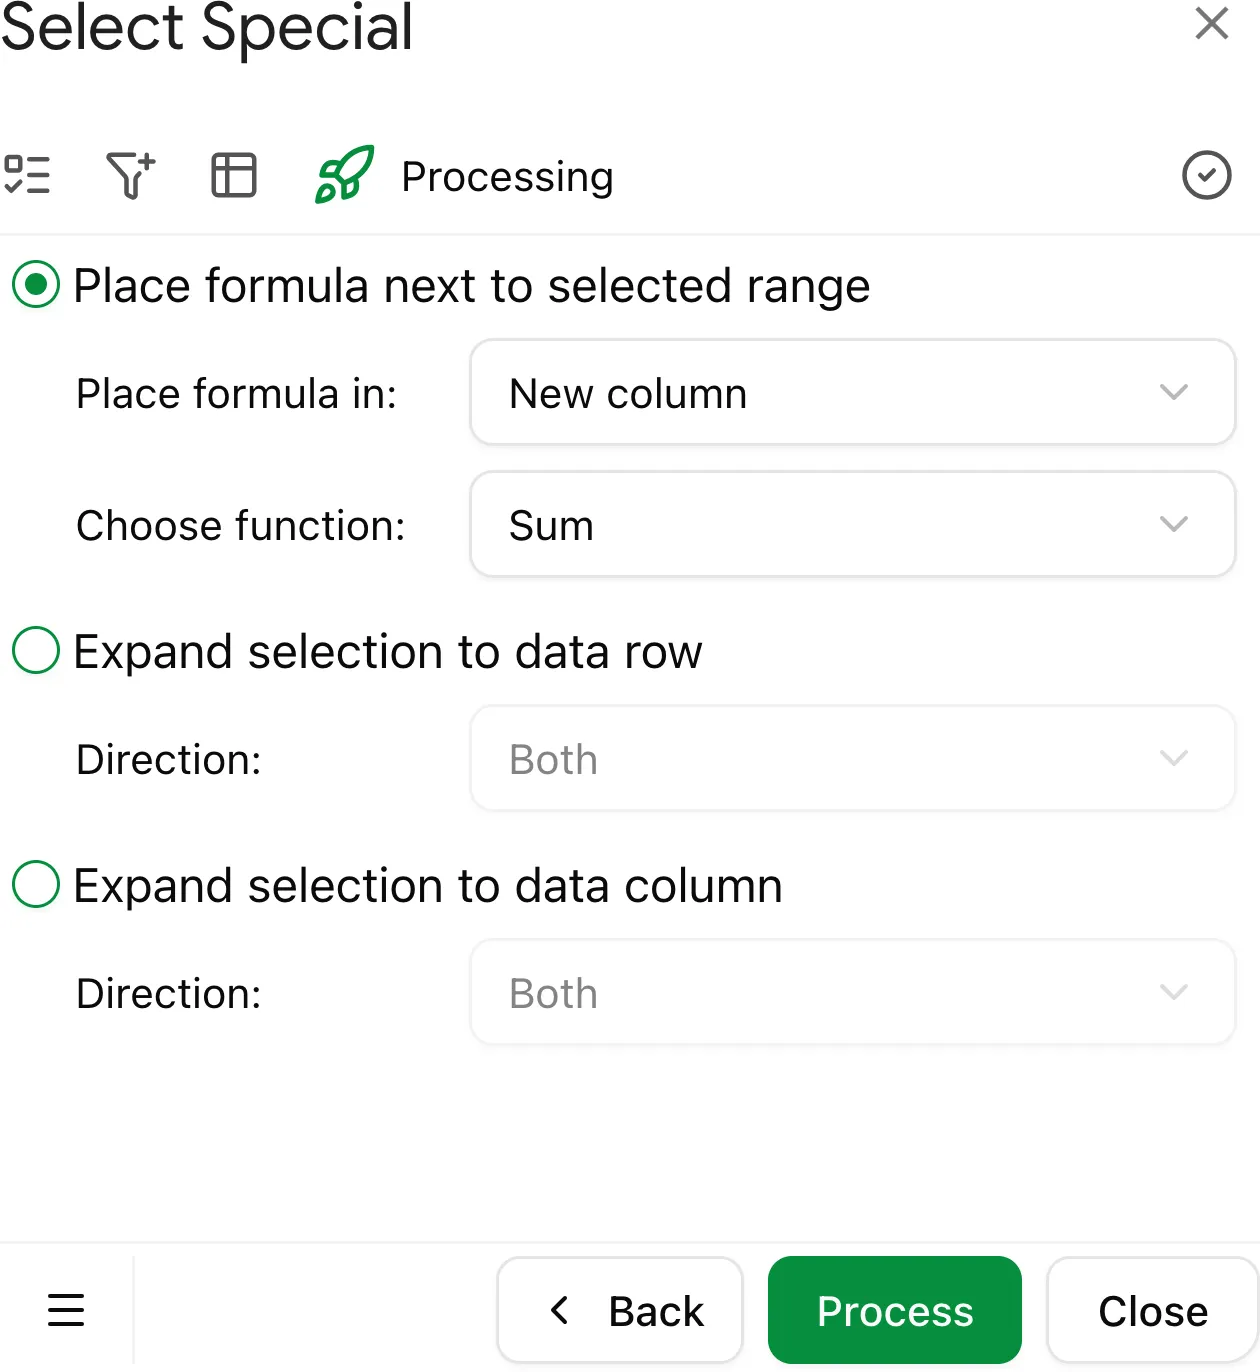
Add Formula
Section titled “Add Formula”Inserts a formula next to your selected cells to calculate values.
Options
Section titled “Options”| Option | Values | Description |
|---|---|---|
| Place formula in | New column | Add formula to the right of selected data |
| New row | Add formula below selected data | |
| Function | SUM | Sum of selected values |
| COUNT | Count of numeric cells | |
| COUNTA | Count of non-empty cells | |
| AVERAGE | Average of selected values | |
| MIN | Minimum value | |
| MAX | Maximum value |
How it works
Section titled “How it works”- Select Special determines the data region for your selection
- For each row (or column), it creates a formula referencing the selected cells
- Formulas are placed in a new column after your data (or new row below)
Example: Count values by color
Section titled “Example: Count values by color”You have a spreadsheet with cells highlighted in different colors (e.g., red for urgent, yellow for pending, green for done). You want to count how many text entries exist for each color.
- Use “Fill colors” to find all cells with a specific background color
- Apply Text filter to include only text values (exclude numbers or blanks)
- Choose “Add Formula” → “New row” → “COUNTA”
- Click Process
Result: A COUNTA formula appears below your data, showing the number of text values with that fill color.
Processing summary
Section titled “Processing summary”After processing completes, you’ll see a summary showing:
For Expand Selection:
- Number of selections expanded
- Direction used
For Add Formula:
- Number of formulas added
- Function used
- Target location (column or row)