How to add subtotals to a table in Google Sheets

Why use Table Total in Google Sheets
Section titled “Why use Table Total in Google Sheets”Adding subtotals manually to grouped data is slow and error-prone. Whenever your data changes, you have to update every total row by hand.
Table Total automates this process — it scans your table, groups rows by the column you choose, and inserts SUBTOTAL formula rows after each group. The result is a structured summary table that reflects your data accurately.
What Table Total does
Section titled “What Table Total does”Table Total inserts SUBTOTAL(...) rows into your spreadsheet, grouped by a key column you select. This is the same functionality as Excel’s Subtotal feature — now available in Google Sheets.
Example: A sales table grouped by Region gets subtotal rows calculating the total sales for each region, plus an optional grand total at the bottom.
How to add subtotals with Table Total
Section titled “How to add subtotals with Table Total”1. Select your data range
Section titled “1. Select your data range”Click any cell inside the table you want to add subtotals to. Table Total will detect the surrounding data region automatically.
2. Open Table Total
Section titled “2. Open Table Total”In the Google Sheets top menu, go to Extensions > Table Total > Start.
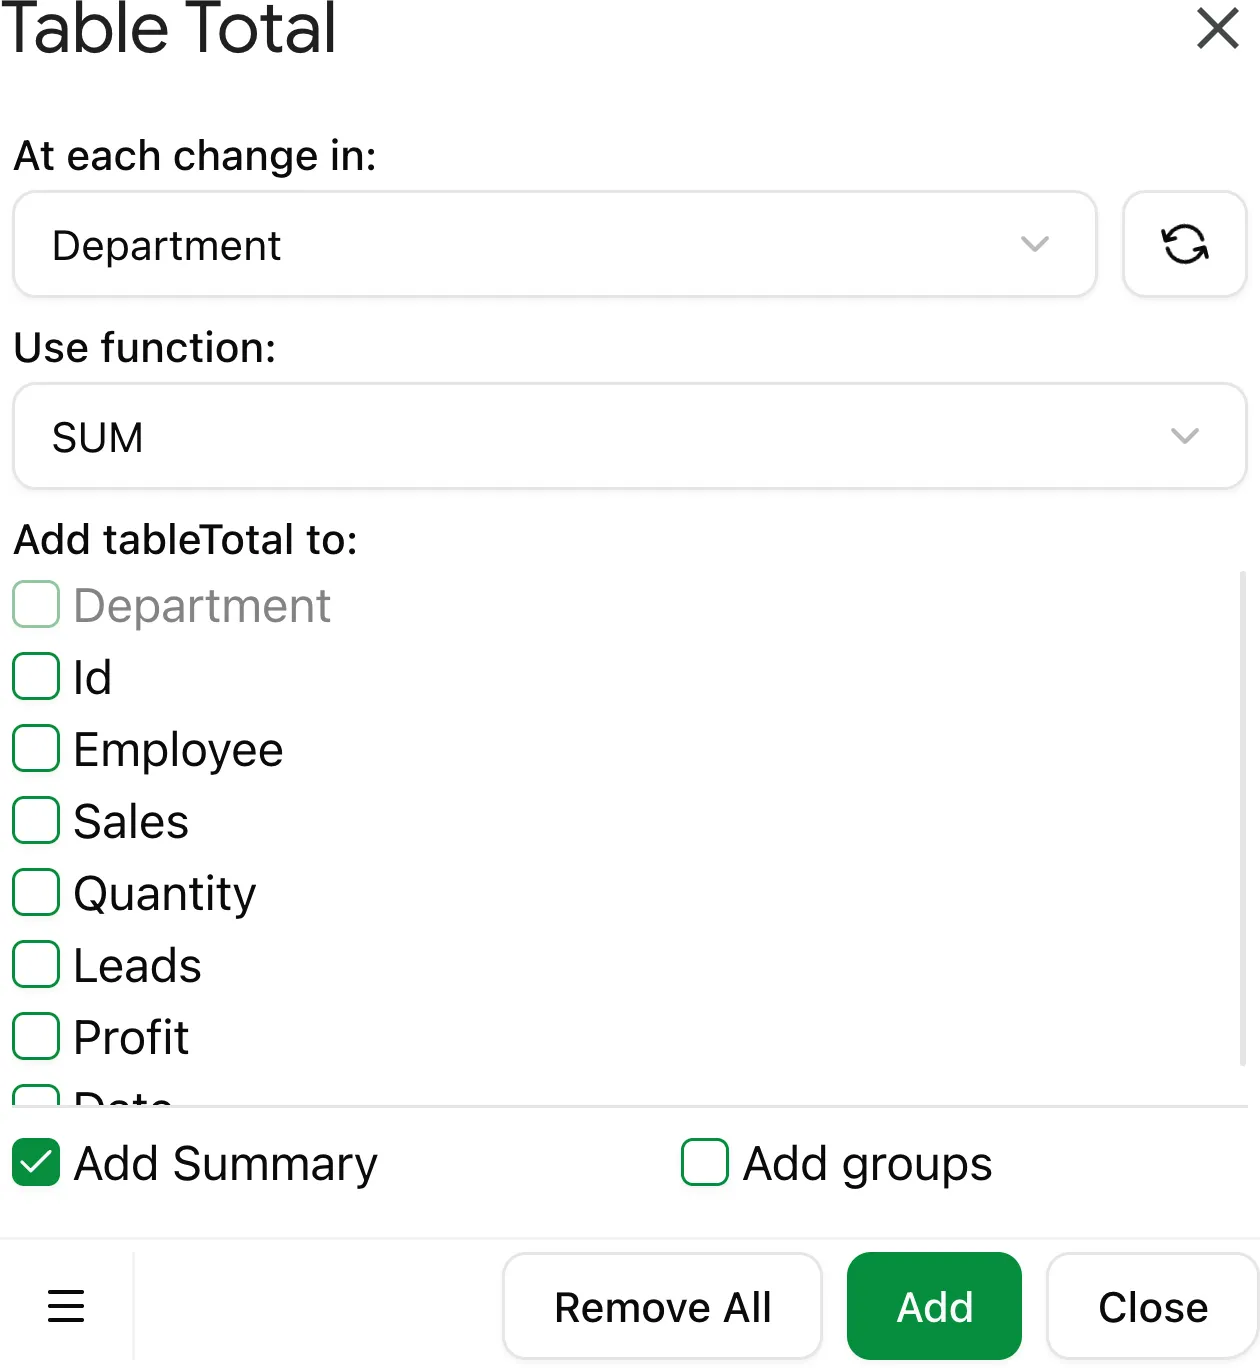
3. Choose the Key Column
Section titled “3. Choose the Key Column”Select the column that contains the group identifiers (e.g., Region, Category, Department). Table Total will insert a subtotal row after each group of consecutive rows with the same value in this column.
4. Choose the Function
Section titled “4. Choose the Function”Select the aggregation function to apply. See Available functions for the full list.
5. Choose columns to total
Section titled “5. Choose columns to total”Select which columns should have subtotal formulas. You can apply totals to one or multiple columns.
6. Configure options
Section titled “6. Configure options”| Option | Description |
|---|---|
| Replace current | Remove existing subtotal rows before adding new ones |
| Add grand total | Insert a grand total row at the bottom of the table |
| Add row groups | Create collapsible row groups in Google Sheets |
7. Click Add Totals
Section titled “7. Click Add Totals”Table Total processes your table and inserts the subtotal rows. A summary shows the number of groups processed.
Removing subtotals
Section titled “Removing subtotals”To remove existing subtotal rows, open Table Total, enable Replace current, and click Add Totals — or use the Remove Totals option in the add-on menu.