Pivot table vs subtotal rows in Google Sheets — and where tables fit in
A pivot table moves your summary to a separate range; subtotal rows keep the totals inside the original table. Here is when each wins, what the native tables group-by view can and cannot do, and how to add subtotal rows in one click.
The short version: a pivot table summarizes your data in a separate range, while subtotal rows put the totals inside the table, right under each group. If you are exploring the numbers, use a pivot table; if the totals need to live in the original layout — for a report you print, share, or keep updating — use subtotal rows. Google Sheets also has a third, newer option: convert the range to a table and open a group-by view, which shows per-group aggregations on screen without changing the sheet at all.
Here is how the three compare, and where each one breaks down.
The three ways to total by group
| — | Pivot table | Tables group-by view | Subtotal rows |
|---|---|---|---|
| Where the totals go | A separate range | On screen only, inside the view | Inside the table, after each group |
| Original layout | Untouched, summary elsewhere | Rearranged while the view is on | Preserved — rows are added in place |
| Backed by formulas | Pivot engine | No — display only | Native SUBTOTAL formulas |
| Referenceable | Via GETPIVOTDATA | No | Yes — plain cells |
| Prints / exports | As a separate block | Prints as shown; lost in CSV / Excel exports | Yes, in any format |
| Best for | Exploratory analysis | A quick on-screen look | Reports kept in the original layout |
Pivot table: a summary in a separate range
Insert ▸ Pivot table is the classic answer, and for analysis it is genuinely great: drag Region into rows, Amount into values, and you have totals per group in seconds. Change your mind and drag in a second dimension — no formulas, no manual ranges.
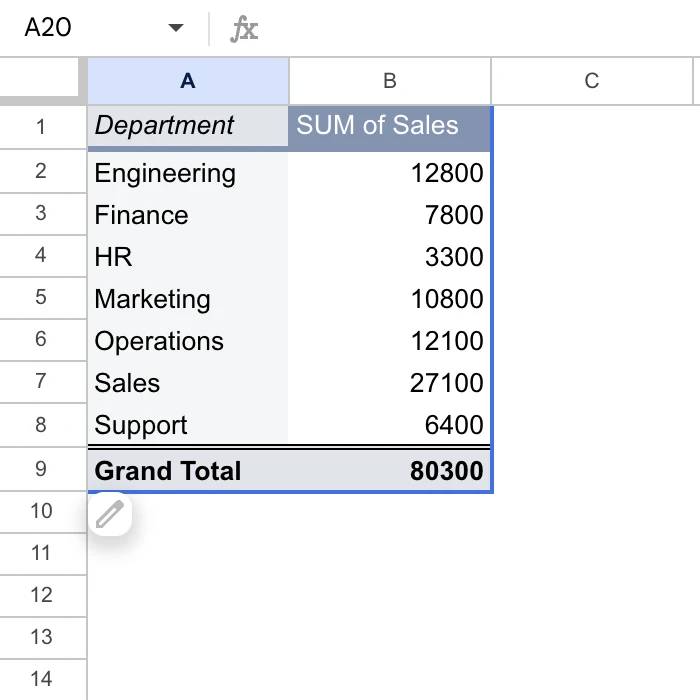
The catch is where the result lives. A pivot table is a copy of the summary, placed on a new sheet or next to your data. Your original table never changes — which is exactly right for exploration, and exactly wrong when the deliverable is the table. If your team expects to see the sales rows with a total under each region, a pivot off to the side answers a different question. You end up maintaining two artifacts: the data and the summary, drifting apart.
Referencing pivot output in other formulas is possible through GETPIVOTDATA, but it is notoriously awkward, and the pivot's shape shifts as the data changes.
Tables group-by view: a quick look, not a layout
Since 2024 Google Sheets has proper tables: select the range, then Format ▸ Convert to table, and you get column types, filters, and structured references like =SUM(DeptSales[Amount]).
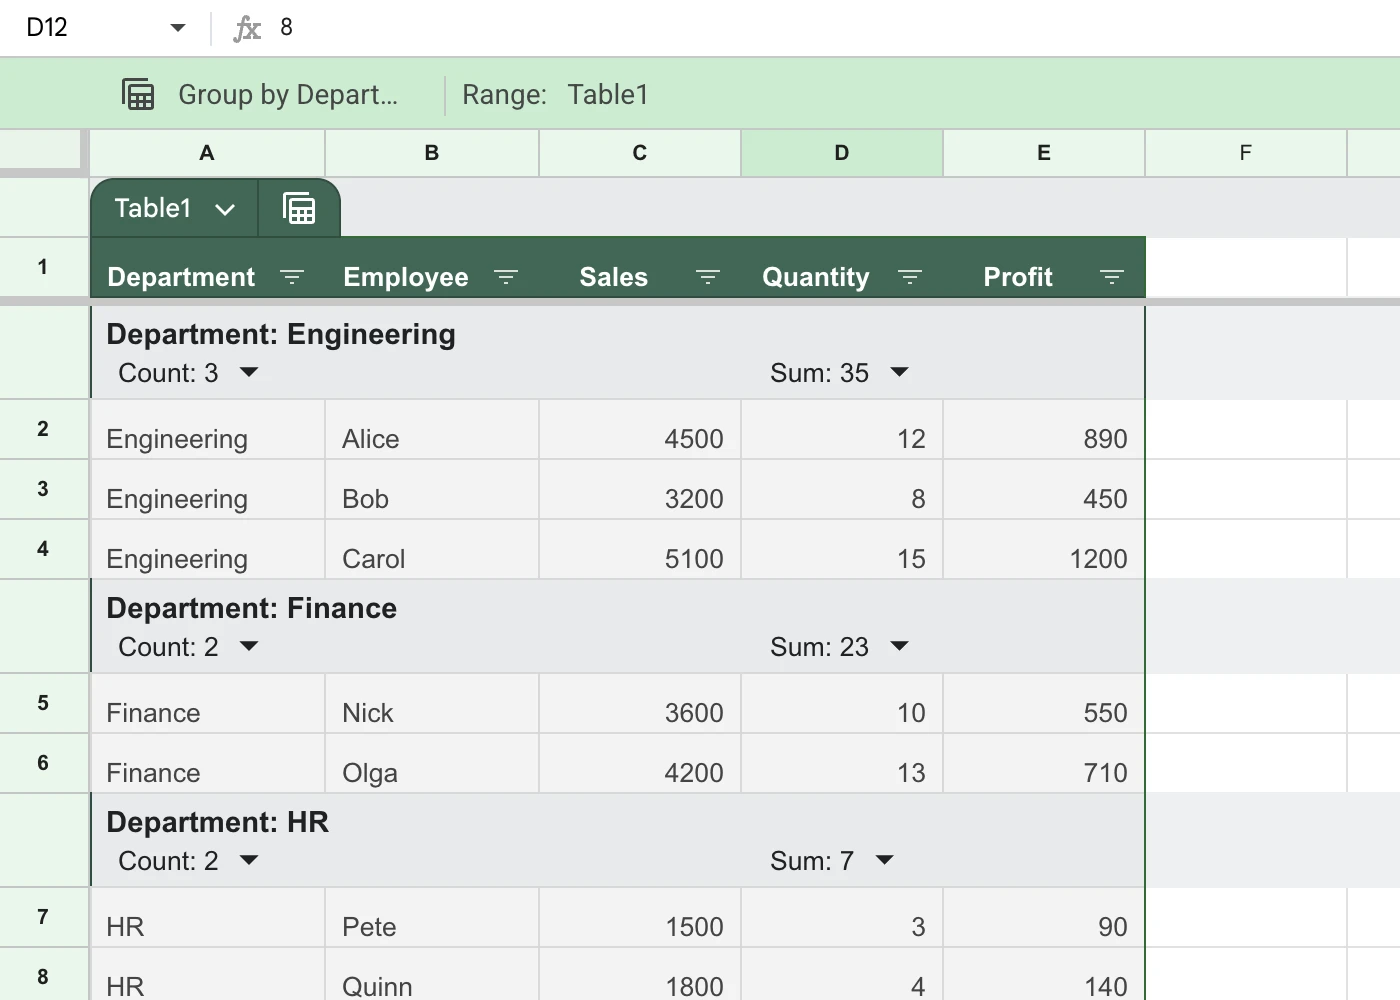
Tables also bring group-by views. Open the view menu on the table and group by a column — Sheets collapses the rows into sections and can show aggregations per group: sum, average, count, min, max, and more.
That sounds like subtotals, but the mechanics matter:
- It is a view, not the sheet. The aggregated numbers exist only while the view is open. Close it (the × on the view bar) and they are gone — nothing was inserted into the grid.
- No formulas, no references. The per-group values are not cells. You cannot point a formula at them, chart them, or copy them out as a range. Structured references like
DeptSales[Amount]still work — but they point at the column's data cells, not at the per-group totals the view shows. - No totals row. Tables in Google Sheets have no built-in footer or totals row at all — unlike tables in Excel.
- The data never gets the totals. Printing and PDF export do render the view as you see it — but exports that carry the data itself (CSV, Excel) only contain real cells, so the group totals are simply not there. Same for anyone reading the table outside the view: the underlying sheet holds no totals at all.
Group-by views are the right tool for the "let me just eyeball totals per category for a second" moment. They are not a way to produce a table that contains its totals.
Subtotal rows: totals inside the table
Subtotal rows are the old-school Excel Data ▸ Subtotal result: the data is sorted by the grouping column, and after each group sits a real row with a real formula — =SUBTOTAL(9, C2:C8) — plus a grand total at the bottom. Because SUBTOTAL ignores other SUBTOTAL cells, the grand total never double-counts the group rows.
Everything the other two options give up, this keeps:
- The totals are plain cells — reference them, format them, chart them.
- The layout is the original table, so it prints and shares exactly as it looks.
- The formulas are native to Sheets — no add-on or feature needed to keep them calculating.
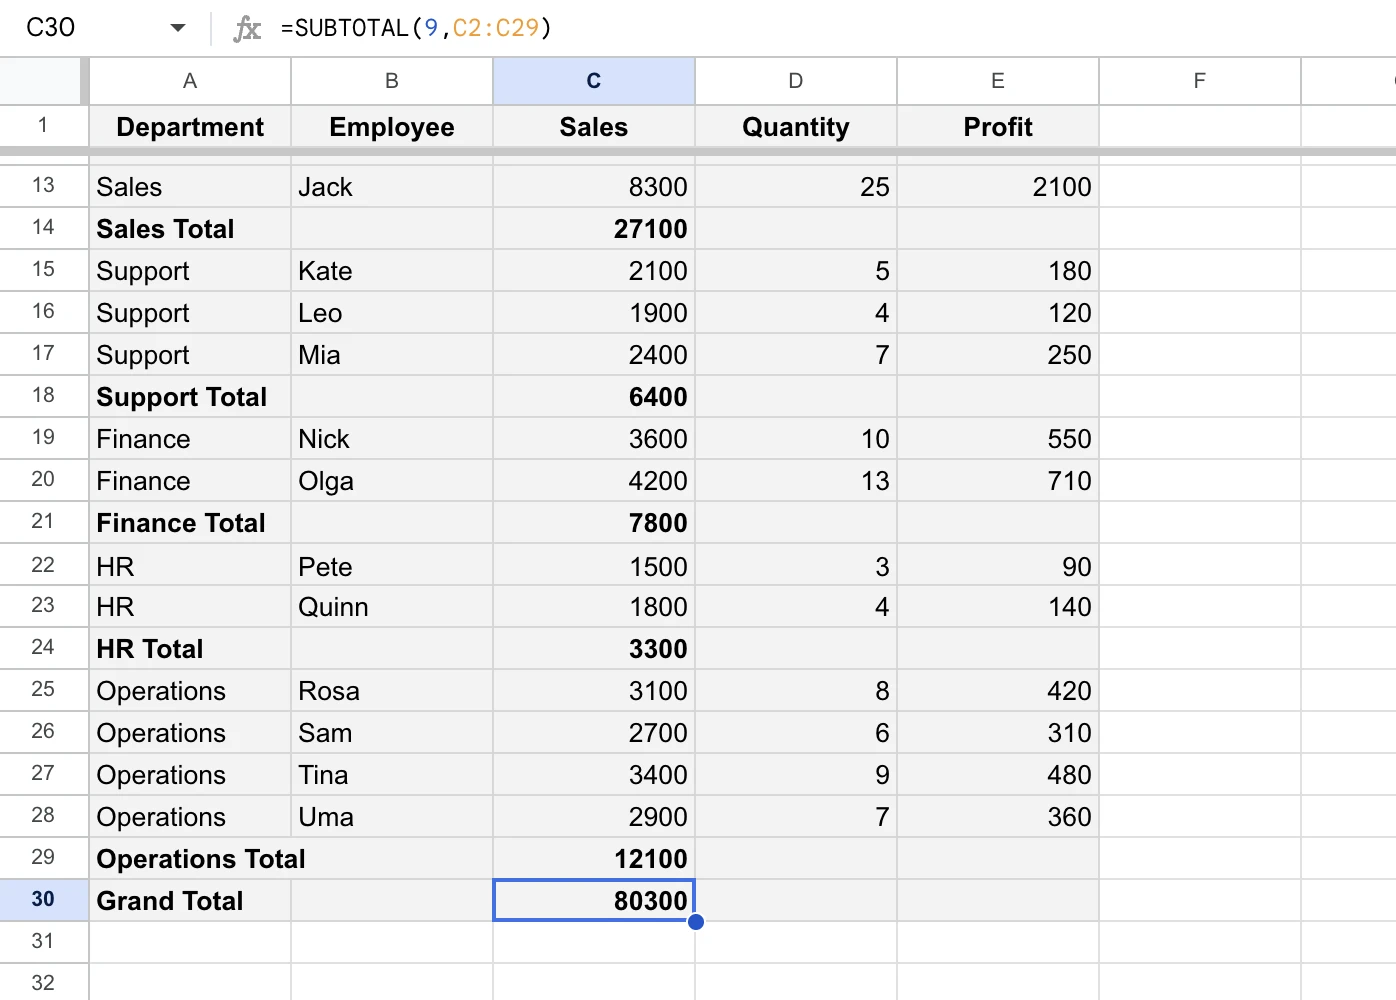
The trade-off is effort. Google Sheets has no button for this, so by hand it means sorting, inserting a row per group, and writing each formula with the right range — ten groups, ten careful edits, redone whenever the data changes. The full manual walkthrough is in our guide to adding subtotal rows.
Which one should you use?
- You are exploring the data — slicing by different dimensions, checking a hunch: pivot table. Nothing beats drag-and-drop for questions you have not settled on yet.
- You need a ten-second look at totals per group, on screen, just for yourself: a tables group-by view. Fastest path, zero changes to the sheet.
- The table itself is the deliverable — a report to print, a sheet to share, numbers other formulas depend on: subtotal rows. It is the only option of the three where the totals actually live in the table.
The three are not exclusive, either. A common setup is subtotal rows in the sheet everyone reads, and a pivot table on a side sheet for your own analysis.
FAQ
Can I get subtotals in Google Sheets without a pivot table?
Yes. Sort by the grouping column and insert SUBTOTAL rows after each group by hand, or add them in one click with Table Total. Either way the totals sit inside your original table.
What is the difference between a pivot table and subtotal rows? A pivot table writes a summary to a separate range and leaves the source table untouched. Subtotal rows are inserted into the table itself, one under each group, in the original layout.
Do Google Sheets tables have a totals row? No. Unlike Excel tables, Google Sheets tables have no footer or totals row. Group-by views can display per-group aggregations, but only inside the view — no rows or formulas are added to the sheet, so data exports like CSV or Excel do not include them.
Which one should I use? Pivot table for analysis, group-by view for a quick look, subtotal rows when the totals must be part of the table — printing, sharing, or feeding other formulas. See the how-to guide for the one-click version.